Browse Resources
Assessment Material -- Answer Key
Resources |
|---|
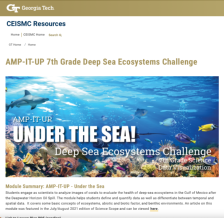 This resource, published by Georgia Tech Research Institute, features an ecology and data visualization activity designed for seventh graders. In this activity, students color-code and quantify data from images of coral to evaluate the health of coral impacted by the Deepwater Horizon Oil Spill. The...
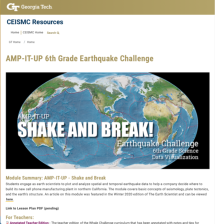 This resource, published by Georgia Tech Research Institute, features a science and data visualization activity designed for sixth graders. In this activity, students plot spatial and temporal earthquake data to make recommendations on where to build a new cell phone manufacturing plant in Northern...
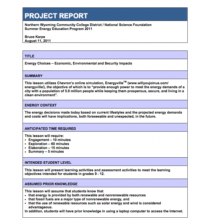 This lesson, created by Bruce Karpe, utilizes Chevron's online simulation, Energyville (the objective of which is to provide "enough power to meet the energy demands of a city with a population of 5.9 million people, while keeping them prosperous, secure, and living in a clean environment") to...
 This collection from the Center for Renewable Energy Advanced Technological Education Resource Center (CREATE) is composed of teaching materials that highlight a lesson on energy unit conversions. The collection is composed of five documents.
Documents include an instructors guide and answer key, a...
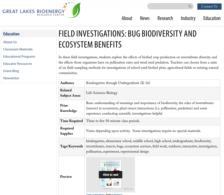 Students will discover the relationship between biofuel crop production and invertebrate biodiversity in these field investigations as well as the "effects those organisms have on pollination rates and weed seed predation." Instructors will have the option to choose from six field-sampling methods...
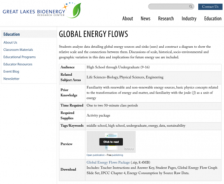 In this activity, students will "analyze data detailing global energy sources and sinks (uses) and construct a diagram to show the relative scale and the connections between them. Discussions of scale, historical, socio-environmental and geographic variation in this data and implications for future...
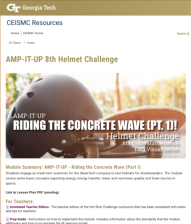 This resource, published by Georgia Tech Research Institute, features a mathematics data visualization activity designed for eighth graders. In this activity, students use a computer simulation to collect data on helmet safety in order to act as crash-test scientists make a recommendations on...
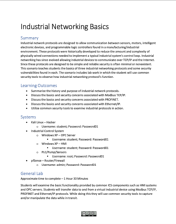 This collection of resources, from the Cybersecurity Education for Advanced Manufacturing Organizations project, is a part of the Industrial Control Systems Basics Scenario. This scenario is a training module that provides background on industrial networking protocols and their security...
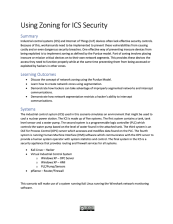 This collection of resources, from the Cybersecurity Education for Advanced Manufacturing Organizations project, is part of the Industrial Control System Zoning Scenario. This scenario is a cybersecurity training module designed to educate students on the importance and implementation of network...
 This resource includes a 199-page student laboratory manual and 244-page instructor guide. The lab manual provides assignments and labs corresponding to concepts found in the Introduction to Vacuum Technology E-book. Each activity unit includes a summary of learning activities, a pre-lab assignment,...
|
| ← PreviousNext → |